Week 4: Exploiting vulnerabilities
This week we’re shifting gears from defense to attack.
Last week I mentioned that there are three ways for malware to get code execution:
- Social engineering
- Exploiting a bug
- Exploiting a feature (also called configuration-related vulnerabilities)
We’re going to talk about the middle one: exploiting bugs.
For the purposes of this week, let’s assume a vulnerability has already been found. Somewhere. In some program.
Let’s also assume that you already have a malicious payload that you want to run.
For our purposes, this will a bit of assembly code that launches calc.exe.
If we can get the calculator to launch in windows, then we assume that we can run anything.
(This is the traditional way to demonstrate arbitrary code execution.)
We have a vuln, and we have a payload — how do we bridge the gap? How exactly can we get from vulnerability to code execution?
I’ll describe two different classes of vulnerabilities: stack buffer overflows, and use-after-free.
How do you turn a vulnerability into an exploit?
Before we get started, I should mention:
You can actually follow along with the lab this week, if you want: we’re using FSExploitMe - a vulnerable ActiveX control, designed to demonstrate stack smashing and use-after-free vulnerabilities. Hilariously, the exploit code is going to be written in JavaScript.
If you want to give it a shot, grab the FSExploitMe repo and stick it in a Windows 7 VM.
The main tool you’ll want to use is WinDBG, which is, no surprise, a windows debugger. It is distributed by Microsoft as part of the free Debugging Tools for Windows package. I have a cheat sheet of useful commands in the Appendix.
(Note: when you attach WinDBG to internet explorer, attach to 2nd iexplore.exe process.)
Since the lab is more or less public, I’m not going to go into too many details about it. Instead, I’ll describe the attacks at a high level.
Exploiting a stack buffer overflow
These days, “buffer overflow” is nearly synonymous with “security bug”.
A buffer overflow is where a program writes data past the end of a buffer. Most languages would raise an error if that happened, but C and C++ just shrug and carry on.
A stack buffer overflow is a buffer overflow which occurs on the stack.
Most functions start and end with something like this.
push ebp
mov ebp,esp
sub esp, 4
…
add esp, 4
pop ebp
ret
The stack frame of a single function looks something like this.
- local variables
- saved frame pointer (ebp)
- return address
- function arguments
At the top of the stack are the local variables of the function, followed by the saved frame pointer, followed by the return address, followed by the arguments to the function, followed by all of the above for whatever function called this function, and so on.
I say “top” but i really mean “bottom” because the stack on x86 is upside down - it starts at some high memory address and grows down towards lower memory addresses.
If we write past the end of a buffer on the stack — if it overflows — we start overwriting the other local variables in the function, then we overwrite the saved frame pointer, then we overwrite the return address, then we overwrite the function arguments, and so on all the way up the stack.
To achieve code execution we need to get the instruction pointer (eip)
to point to our code. One way to do that is with the ret instruction.
When a function returns — when the ret instruction executes — it pops
the return address off the stack and puts it in eip.
(ret is basically a synonym for pop eip).
So if we overwrite the return address on the stack with a pointer to our code, and the function returns, then we’ve achieved code execution.
Question: where are we going to put our code?
Answer: we can put it on the stack, right after our fake return address.
Problem: what’s its address?
Uh.
The historical answer to this problem was a “nop sled”: the attacker would prefix their code with a bunch of no-op (nop) instructions, jump somewhere in memory, and hope they landed somewhere in the nops. If they were successful, the CPU would execute all the nops and eventually reach the payload.
nop sled + payload + return address
However, we can do better.
The key insight is that right after the ret statement is executed,
we know exactly where the stack pointer (esp) points:
it point right after our return address.
So we just need to put our payload right after our return address and
somehow jump to esp.
We need the address of a jmp esp instruction.
This never occurs in a reasonable program, but could occur in the middle of
another instruction sequence, since the x86 instruction encoding is awful.
The magic byte sequence is FF E4.
filler + address of jmp esp instruction + payload
Example
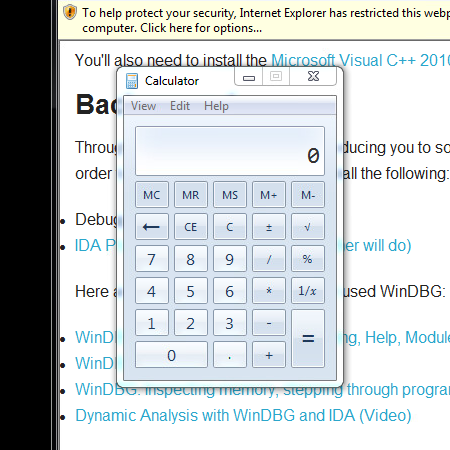
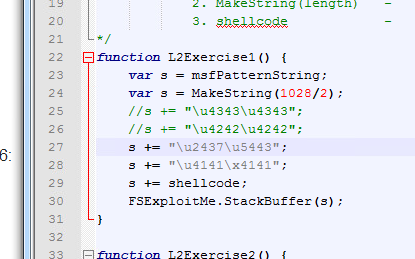
I was able to successfully trigger code execution in Lesson 2 of the lab using these techniques.
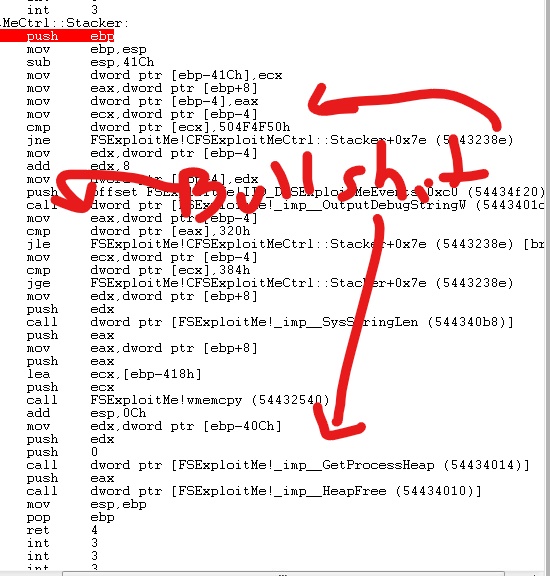
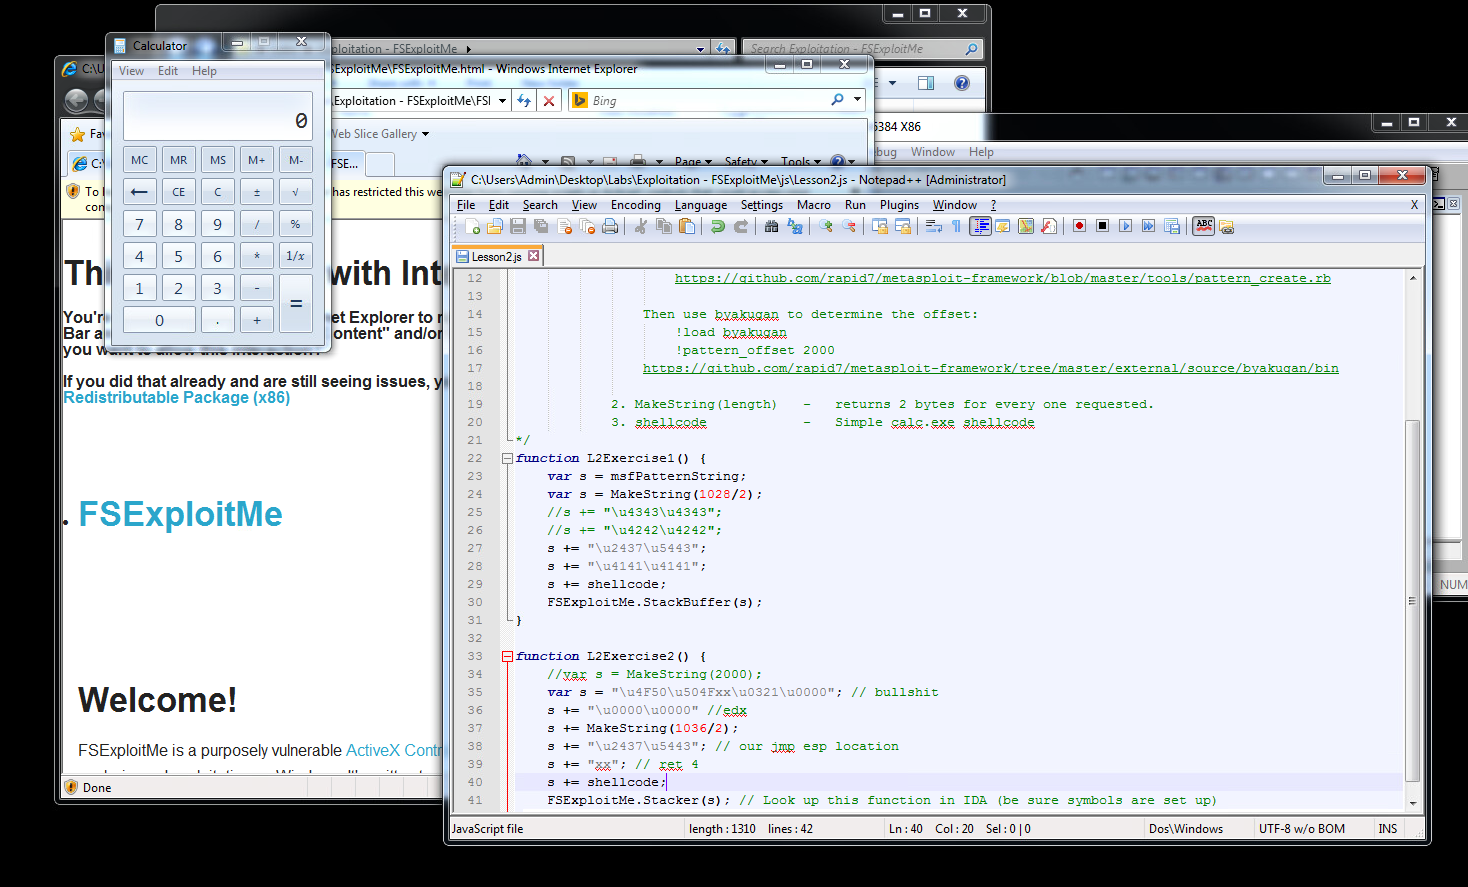
Part 2 was exactly the same as Part 1, except the vulnerable function checked some parts of the buffer before copying it to the stack, and exited if they weren’t the right values.
Mitigations
Stack canaries: on entry to a function, it pushes a “canary” value onto the stack,
which it checks before returning.
If the canary has been modified, the program aborts.
GCC and clang can insert stack canaries if you compile with the -fstack protector option.
This protection is not foolproof, however. If the vulnerability allows writing to arbitrary stack locations, the attacker can hop over the canary, leaving it unmodified
Non-executable stack. Code should usually only be executed from the code segment, not from the stack, so another mitigation is to mark the stack non-executable. This can be worked around, but it requires more difficult techniques like return-oriented programming.
Aside: Heartbleed
Heartbleed was not a buffer overrun in this sense. Buffer overruns are about a user-supplied value overrunning a fixed-size buffer, allowing us to write to values on the stack or heap. Heartbleed was about the server reading a user-specified amount of memory from an uninitialized buffer, leaking memory to the internet. It didn’t modify memory and couldn’t be used to achieve code execution.
In case you were wondering.
Exploiting a use-after-free bug
A use-after-free bug is where a program allocates an object, frees it, and then uses it again. You are not supposed to use memory after freeing it, so the results are undefined.
Exploiting a use-after-free bug generally follows these four steps:
- Vulnerable program frees an object
- Attacker allocates an object of the same size, overwriting the freed object
- Attacker puts shellcode somewhere in memory
- Vulnerable program uses the object again
The main idea is that a use-after-free allows us to overwrite the freed object with whatever we want. In the previous example, we overwrote the stack stack. Here, we overwrite some object in memory (on the heap). How is that possible? It’s possible because the developer accidentally freed memory before it was supposed to be, allowing us to allocate our own object in the same spot. This normally isn’t a problem - this happens all the time in normal program execution: some function allocates an object and frees it, some other function allocates a different object in the same spot — that’s the entire point of dynamic memory allocation.
The difference — the part that makes this an exploitable vulnerability — is that the program then tries to access the memory after it has already been freed.
Okay, so we can overwrite memory, that’s great, but how does it lead to code execution?
vtables
Object oriented programming can be characterized as bundling state and behivour.
The way this is manifests in C++ (which is what we’re targeting) is that objects with virtual methods have a vtable which contains a function pointer for each method.
The first word of an object points to its vtable, and the vtable points to one (or more) functions. When some code wants to call a method, it looks up the vtable, finds the function pointer, and makes an indirect call to that address.
Hey, if we overwrite the vtable pointer of an object, we can make it point wherever we want! If we make it point to (a pointer to) our payload, and we then call a virtual method on that object, that gives us code execution!
Low fragmentation heap
Not so fast, remember three paragraphs ago when I said that a use-after-free let us overwrite memory? Well, it’s not as easy as I made it sound. The memory allocator is free to give us memory from wherever it wants — we can’t specifically request that it give us a particular chunk, even if we know it was just freed. Chances are good that it will give a completely unrelated block of memory.
We’re going to need to know a little bit more about how the allocator works.
The specifics are going to vary depending on the program you’re targeting. For the FSExploitMe demo, I’m going to talk about one specific way to coerce Windows’ memory allocator into giving us the memory we want. There are undoubtedly other ways.
In an effort to reduce memory fragmentation, Windows (and many other high-performance allocators) will allocate small objects from a pools of objects of the same size.
It turns out that after the 18th allocation of a particular size, windows will create a size-specific allocator pool of that size. This is called the low fragmentation heap.
It’s a lot easier to target the low fragmentation heap than the general heap.
So if we want to exploit this, and we know the size of the object we want to overwrite, we just have to make 18 allocations of that size to trigger the low fragmentation heap, allocate our target object (which will go on the heap), free it, and finally make one more allocation. This last allocation will always replace the freed object, allowing us to overwrite it.
Heap Spray
We’re done, right? No! The payload has to go somewhere.
The object probably won’t be large enough to contain our payload, and anyway we don’t know what address it will have. We need to know the address in order to have our vtable entry point to it.
The solution is a heap spray.
It turns out that the behaviour of large allocations is predicable in a similar (but different) way to small allocations. If we request a large chunk of memory from the allocator, none of the free space it has available will be large enough so it will give us a chunk at the end of the heap, aligned to some predictable value. If we keep doing this, we can fill up the upper portion of memory with our payload code at fixed intervals. We don’t know exactly where each chunk of memory will be allocated, but we know that if we allocate enough copies of it, one of them will wind up at a predictable address.
On Windows, this starts somewhere in the 0a0a0000 address range.
(In the lab, the L3HeapSpray function does this by allocating 100MiB of memory in 64KiB chunks.)
Example
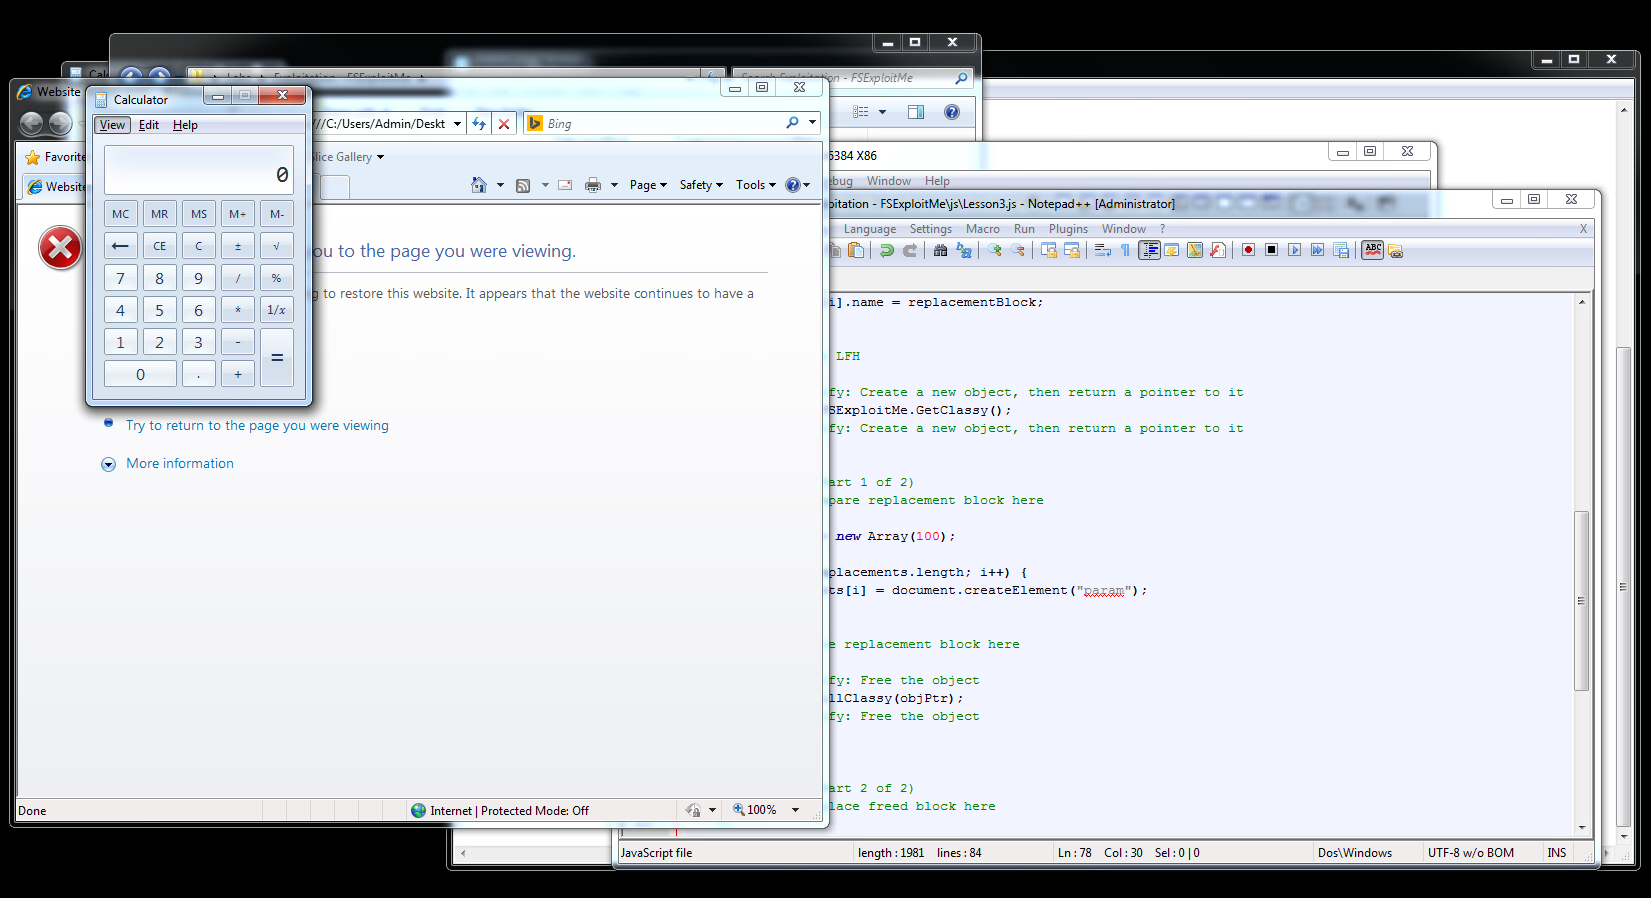
I was able to successfully exploit the Lesson 3 code in FSExploitMe using this technique.
Mitigations
Garbage collection automatically frees memory when it is no longer in use, freeing the programmer from the burden of managing memory and eliminating use-after-free bugs. This doesn’t help languages without garbage collection, though.
valgrind can detect use-after-free and other memory corruption bugs.
Conclusion
I’ve done my best to describe these two vulnerabilities, but there’s no substitute for hands-on experience. It’s one thing to know intellectually how an attack works, and quite another to actually pull it off it practice, so I hope you’ll take a look at FSExploitMe and give it a try yourself.
Personally, I’ve heard about buffer overflow attacks thousands of times, but I had never actually performed one until this week.
It was immensely satisfying.
Glossary
vulnerability trigger: invokes a bug to obtain control
shellcode: malicious payload; code run after a control is attained
memory corruption: accessing memory in an invalid way which results in undefined behaviour
Acknowledgements
This post was based on lectures given by Brad Antoniewicz of Foundstone (McAfee professional services).
Appendix: WinDBG
Here is my cheat sheet of useful WinDBG commands.
dd [addr] - print dword at address
db [addr] - print hex dump or string at address

bp [addr] - set breakpoint at address
s start end bytes - search for bytes between start and end

?[expr]     - evaluate and print an expression
r           - print registers
k           - print contents of stack
k [n]       - print n dwords of stack

g           - continue execution ("go")
              you can also press F5

!teb - print information about the stack (thread execution block?)
!peb - print information about the heap (process excecution block?)

!address esp - print informaiton about where the address in esp points to

    (this command takes a long time!)

!load byakugan              - load the byakugan module
!pattern_offset 2000

    after overwriting the stack with the metasploit pattern string
    and triggering a crash, run this command to figure out which
    registers were clobbered and what offset in the buffer clobbered them